Tutorial 4A:
Using Piecewise Linear File Sources for Test Benches
This material is by Bo Zhao and
Steven Levitan for the environment at the University of Pittsburgh
We are using the NCSU 1.6 Beta
CDK and Virtuoso 1.6.1.2
Please consult the NCSU EDA Wiki for
background information
Many thanks to the team at
NCSU for all their hard work!
Please see our tutorial
on setting up the design environment and running Virtuoso
This tutorial shows how to use the PWL Generator created by Nicolas Moore
at the University
of Pittsburgh
First, copy the file
pwl_generator.pl from the $CLASS/PWL_Generator
directory to your local directory.
To use this program the
command is:
perl pwl_generator.pl <pulse width in ns> <risefall in ns> <highval>
<lowval> <csv
file> <output directory>
The csv
file is a comma separated text file which can be created by a text editor or by
using a spreadsheet program like excell and saving
the result as a csv file. The program will create a
new directory with many pwl files in it. It
will not overwrite an existing directory. It will create a file for each bit of
each signal as well as a clock file. The specific timing for the test is that
the data will change in the middle of the predefined clock "high"
period.
The csv
file has a fixed format:
·
The first line must give the number of bits for each signal (i.e.,
signals are 1-bit but buses are multi-bit)
·
The second line shows the name of each signal
·
Every line afterwards gives the data value for that signal at the next
high period of the clock. Values are in decimal (base 10).
This is an example file (test.csv):
1,2,4
A,B,Data
0,3,1
1,2,2
1,1,3
0,0,4
1,3,5
1,2,6
0,1,7
1,0,8
1,3,9
0,2,10
0,1,11
1,0,12
1,3,13
0,2,14
1,1,15
A is a single bit value, B is
a 2-bit bus and Data is a 4-bit bus. Running the program with the command:
perl pwl_generator.pl 2 0.1 1.8 0 test.csv
TEST
Will create a directory called
TEST and put 8 files in it:
A_0.pwl
B_0.pwl
B_1.pwl
Data_0.pwl
Data_1.pwl
Data_2.pwl
Data_3.pwl
CLK.pwl
Each file will have the commands for generating a
waveform consisting of time/voltage pairs for example A_0.pwl will have:
0e-9 0
1.9e-9 0
2e-9 1.8
3.9e-9 1.8
4e-9 1.8
5.9e-9 1.8
6e-9 0
7.9e-9 0
8e-9 1.8
9.9e-9 1.8
10e-9 1.8
11.9e-9 1.8
12e-9 0
13.9e-9 0
14e-9 1.8
15.9e-9 1.8
16e-9 1.8
17.9e-9 1.8
18e-9 0
19.9e-9 0
20e-9 0
21.9e-9 0
22e-9 1.8
23.9e-9 1.8
24e-9 1.8
25.9e-9 1.8
26e-9 0
27.9e-9 0
28e-9 1.8
29.9e-9 1.8
Each file needs to be
associated with its own PWLF signal source in Virtuoso. You must give the path
to the file in the “file” field of this component, for example:
~/projects/Lab8/TEST/A_0.plw
This is an example test bench with
three of the eight PWLF sources connected to an AOI gate:
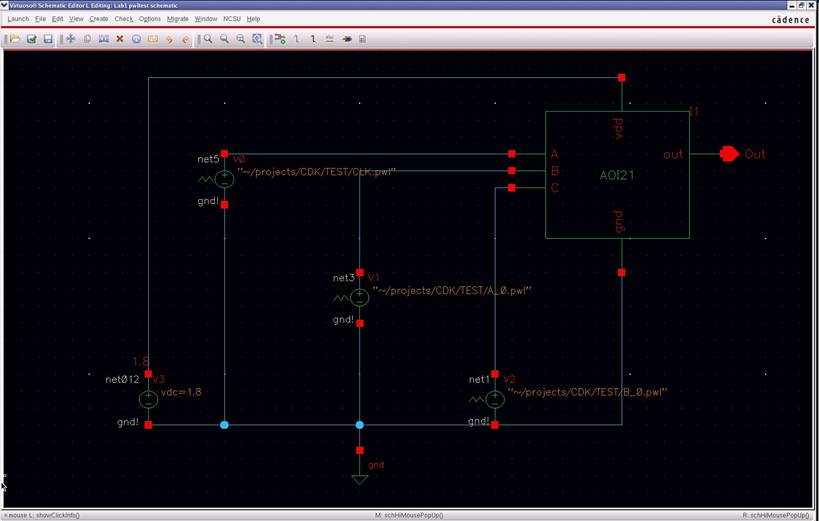
This system simulates with the following waveform:
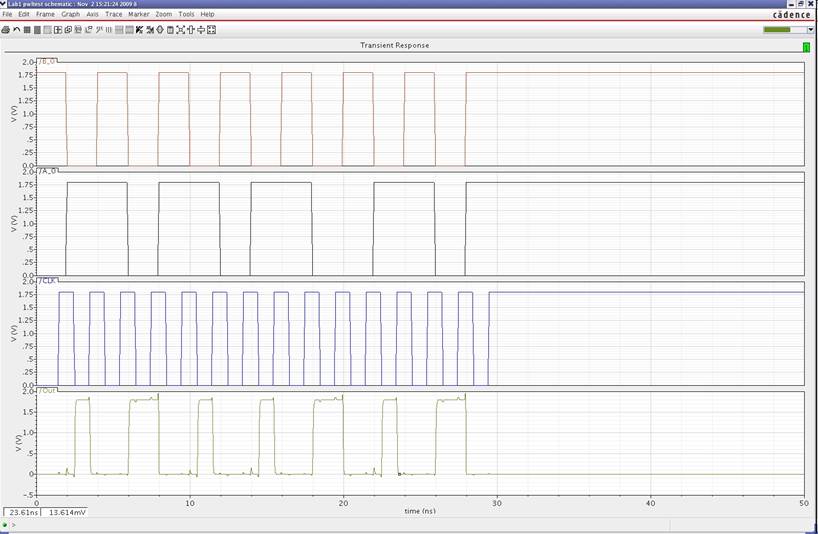
Note the relative timing of all the signals. A_0 and B_0 change while the clock is high. The clock starts low and has a 50% duty cycle with a 2ns period. All signals go from 0v to 1.8v and have a 100ps rise and fall time. The waveform stops on the 15th low-to-high transition of the clock. That corresponds to the last line of the original csv file.
-- Thanks Nic wherever you are!